
Sing, play or speak into the microphone and watch it as a waterfall on a log-frequency axis, where every octave is the same height and every note sits on its own scale line. Tonescope draws the pitch it hears as a line through the picture and reads it out as a note name and cents.
Tonescope 0.1.2 is open source under MIT OR Apache-2.0, a single native executable for macOS, Linux and Windows written in Rust.
Why a log-frequency axis
A linear spectrogram spends half its height on the top octave and squeezes everything a voice or an instrument actually plays into a strip at the bottom. Musical pitch is logarithmic, so Tonescope gives each octave equal room, interpolates between FFT bins at the low end and takes the peak over each pixel row at the high end. Scale lines for the chosen key line up with the rows, so you read a note off the picture the way you read it off a keyboard.
Project snapshot
The pitch track is YIN, measured from 40 to 2000 Hz. The smaller the FFT, the higher the lowest pitch it can measure; the sidebar shows the current limit.
14
Scales and modes, on any of 12 tonics
40–2000 Hz
Pitch tracking range
1024–16384
FFT sizes, with hop 128–2048
0.1.2
Current release · MIT OR Apache-2.0
See the note, not just the frequency
1/3
Pick a tonic and a scale (major, three minors, five modes, pentatonics, blues, whole tone) and Tonescope draws its lines across the waterfall, tonic highlighted, A4 tunable from 400 to 480 Hz. Hover anywhere for frequency, nearest note and cents, level in dB, how long ago, and the pitch of that column; turn on harmonic lines to see where the 2nd to 8th partials of that point land.
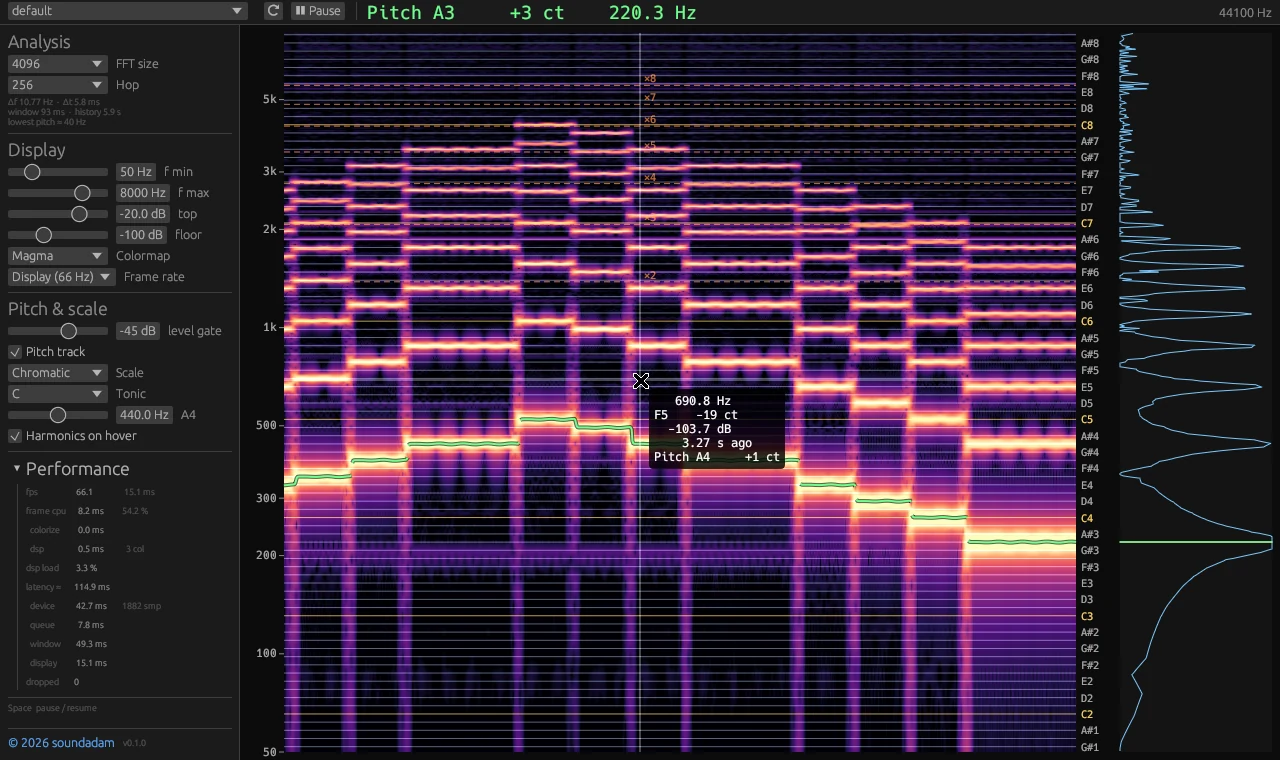
A synthesized melody with eight harmonics, fed through a virtual microphone into Tonescope 0.1.2 on Linux. The green line is the tracked pitch; the hover box reads the point under the cursor.
The fundamental, not the loudest partial
2/3
When an overtone is stronger than the fundamental, the pitch readout stays on the fundamental instead of jumping an octave. Frames below the level gate are not measured at all, so silence does not turn into a wandering line. The live spectrum on the right marks both the strongest frequency and the detected pitch, so you can see when they disagree.
Fast enough to sing along to
3/3
Each frame colours only the new columns and updates the texture in place. The frame rate follows the display, can be capped at 60 or 30 fps, and drops on its own when the input stays quiet. The Performance panel breaks down CPU per frame and estimates the delay from sound to screen, split into device, queue, analysis window and display. Space pauses, and a paused picture can still be re-ranged and zoomed.